 |
Peano
|
|
Peano
|
Functions | |
| calc_a (g, nu=3) | |
| exponents of the polynomials of the sedov solution g - the polytropic gamma nu - the dimension | |
| calc_beta (v, g, nu=3) | |
| beta values for the sedov solution (coefficients of the polynomials of the similarity variables) v - the similarity variable g - the polytropic gamma nu- the dimension | |
| sedov (t, E0, rho0, g, n=1000, nu=3) | |
| solve the sedov problem t - the time E0 - the initial energy rho0 - the initial density n - number of points (10000) nu - the dimension g - the polytropic gas gamma | |
Variables | |
| float | gas_gamma = 5.0 / 3.0 |
| This file is part of SWIFT. | |
| float | rho0 = 1.0 |
| float | P0 = 1.0e-6 |
| int | v0 = 1 |
| float | time = 0.2 |
| str | pvdfile = "particles.pvd" |
| reader = ParticleVTUReader(pvdfile=pvdfile, snapshot_time=time) | |
| partData = reader.load() | |
| x = partData.x[:, 0] | |
| y = partData.x[:, 1] | |
| vx = partData.v[:, 0] | |
| vy = partData.v[:, 1] | |
| u = partData.u | |
| P = partData.pressure | |
| rho = partData.density | |
| r = np.sqrt((x - 1.0) ** 2 + (y - 1.0) ** 2) | |
| v = -np.sqrt(vx**2 + vy**2) | |
| r_bin_edge = np.arange(0.0, 1.0, 0.02) | |
| float | r_bin = 0.5 * (r_bin_edge[1:] + r_bin_edge[:-1]) |
| rho_bin | |
| _ | |
| statistic | |
| bins | |
| v_bin | |
| P_bin | |
| u_bin | |
| rho2_bin | |
| v2_bin | |
| P2_bin | |
| u2_bin | |
| rho_sigma_bin = np.sqrt(rho2_bin - rho_bin**2) | |
| v_sigma_bin = np.sqrt(v2_bin - v_bin**2) | |
| P_sigma_bin = np.sqrt(P2_bin - P_bin**2) | |
| u_sigma_bin = np.sqrt(u2_bin - u_bin**2) | |
| int | N = 1000 |
| float | x_s = np.arange(0, 2.0, 2.0 / N) - 1.0 |
| float | rho_s = np.ones(N) * rho0 |
| float | P_s = np.ones(N) * rho0 |
| int | v_s = np.ones(N) * v0 |
| float | u0 = rho0 * P0 * (gas_gamma - 1) |
| float | us = 0.5 * (gas_gamma - 1) * v0 |
| float | rs = us * time |
| float | u_s = P_s / (rho_s * (gas_gamma - 1.0)) |
| float | s_s = P_s / rho_s**gas_gamma |
| figsize | |
| str | line_color = "C4" |
| str | binned_color = "C2" |
| int | binned_marker_size = 4 |
| scatter_props | |
| errorbar_props = dict(color=binned_color, ms=binned_marker_size, fmt=".", lw=1.2) | |
| int | rows = 2 |
| int | cols = 2 |
| color | |
| alpha | |
| lw | |
| yerr | |
| labelpad | |
| str | fname = f"NohProfile{time:.4f}.png" |
| dpi | |
| bool | plot_errorbars = False |
| z = partData.x[:, 2] | |
| vz = partData.v[:, 2] | |
| fig = plt.figure(figsize=(7, 7 / 1.6)) | |
| float | boxsize = 1.0 |
| vel_x = partData.v[:, 0] | |
| pressure = partData.pressure | |
| density = partData.density | |
| mass = partData.mass | |
| energy = partData.u | |
| float | v_r = x * vel_x / r |
| float | rho_0 = 1.0 |
| float | P_0 = 1.0e-6 |
| float | E_0 = 1.0 |
| r_s = np.insert(r_s, np.size(r_s), [r_shock, r_shock * 3]) | |
| r_shock | |
| dict | sim_props |
| dict | solution_props |
| ax1 = fig.add_subplot(2, 2, 1) | |
| ax2 = fig.add_subplot(2, 2, 2) | |
| ax3 = fig.add_subplot(2, 2, 3) | |
| ax4 = fig.add_subplot(2, 2, 4) | |
| direction | |
| top | |
| True | |
| right | |
| vel_y = partData.v[:, 1] | |
| vel_z = partData.v[:, 2] | |
| float | rho_L = 1.0 |
| float | rho_R = 0.125 |
| float | v_L = 0.0 |
| float | v_R = 0.0 |
| float | P_L = 1.0 |
| float | P_R = 0.1 |
| float | x_min = 0.0 |
| float | x_max = 2.0 |
| solver = sphtools.RiemannSolver(gas_gamma) | |
| tuple | delta_x = (x_max - x_min) / N |
| tuple | center = (x_max + x_min) / 2 |
| c_R = np.sqrt(gas_gamma * P_R / rho_R) | |
| tuple | x_shock = (c_R + v_R) * time |
| ms | |
| plotSolution.calc_a | ( | g, | |
nu = 3 |
|||
| ) |
exponents of the polynomials of the sedov solution g - the polytropic gamma nu - the dimension
Definition at line 82 of file plotSolution.py.
Referenced by sedov().

| plotSolution.calc_beta | ( | v, | |
| g, | |||
nu = 3 |
|||
| ) |
beta values for the sedov solution (coefficients of the polynomials of the similarity variables) v - the similarity variable g - the polytropic gamma nu- the dimension
Definition at line 104 of file plotSolution.py.
Referenced by sedov().

| plotSolution.sedov | ( | t, | |
| E0, | |||
| rho0, | |||
| g, | |||
n = 1000, |
|||
nu = 3 |
|||
| ) |
solve the sedov problem t - the time E0 - the initial energy rho0 - the initial density n - number of points (10000) nu - the dimension g - the polytropic gas gamma
Definition at line 141 of file plotSolution.py.
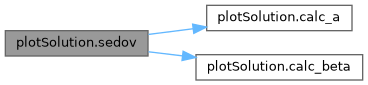
References calc_a(), and calc_beta().
|
protected |
Definition at line 70 of file plotSolution.py.
| plotSolution.alpha |
Definition at line 139 of file plotSolution.py.
| plotSolution.ax1 = fig.add_subplot(2, 2, 1) |
Definition at line 255 of file plotSolution.py.
| plotSolution.ax2 = fig.add_subplot(2, 2, 2) |
Definition at line 256 of file plotSolution.py.
| plotSolution.ax3 = fig.add_subplot(2, 2, 3) |
Definition at line 257 of file plotSolution.py.
| plotSolution.ax4 = fig.add_subplot(2, 2, 4) |
Definition at line 258 of file plotSolution.py.
| str plotSolution.binned_color = "C2" |
Definition at line 118 of file plotSolution.py.
| int plotSolution.binned_marker_size = 4 |
Definition at line 119 of file plotSolution.py.
| plotSolution.bins |
Definition at line 70 of file plotSolution.py.
| float plotSolution.boxsize = 1.0 |
Definition at line 64 of file plotSolution.py.
Definition at line 74 of file plotSolution.py.
Definition at line 64 of file plotSolution.py.
| plotSolution.color |
Definition at line 139 of file plotSolution.py.
| int plotSolution.cols = 2 |
Definition at line 134 of file plotSolution.py.
Definition at line 63 of file plotSolution.py.
| plotSolution.density = partData.density |
Definition at line 69 of file plotSolution.py.
| plotSolution.direction |
Definition at line 281 of file plotSolution.py.
| plotSolution.dpi |
Definition at line 179 of file plotSolution.py.
| float plotSolution.E_0 = 1.0 |
Definition at line 214 of file plotSolution.py.
| plotSolution.energy = partData.u |
Definition at line 71 of file plotSolution.py.
| plotSolution.errorbar_props = dict(color=binned_color, ms=binned_marker_size, fmt=".", lw=1.2) |
Definition at line 131 of file plotSolution.py.
| plotSolution.fig = plt.figure(figsize=(7, 7 / 1.6)) |
Definition at line 129 of file plotSolution.py.
| plotSolution.figsize |
Definition at line 115 of file plotSolution.py.
| str plotSolution.fname = f"NohProfile{time:.4f}.png" |
Definition at line 178 of file plotSolution.py.
| float plotSolution.gas_gamma = 5.0 / 3.0 |
This file is part of SWIFT.
Copyright (c) 2016 Matthieu Schaller (schal.nosp@m.ler@.nosp@m.strw..nosp@m.leid.nosp@m.enuni.nosp@m.v.nl)
This program is free software: you can redistribute it and/or modify it under the terms of the GNU Lesser General Public License as published by the Free Software Foundation, either version 3 of the License, or (at your option) any later version.
This program is distributed in the hope that it will be useful, but WITHOUT ANY WARRANTY; without even the implied warranty of MERCHANTABILITY or FITNESS FOR A PARTICULAR PURPOSE. See the GNU General Public License for more details.
You should have received a copy of the GNU Lesser General Public License along with this program. If not, see http://www.gnu.org/licenses/.
Copyright (c) 2016 Matthieu Schaller (schal.nosp@m.ler@.nosp@m.strw..nosp@m.leid.nosp@m.enuni.nosp@m.v.nl) Modified to fit the purposes of the Peano4 Noh 3D benchmark.
This program is free software: you can redistribute it and/or modify it under the terms of the GNU Lesser General Public License as published by the Free Software Foundation, either version 3 of the License, or (at your option) any later version.
This program is distributed in the hope that it will be useful, but WITHOUT ANY WARRANTY; without even the implied warranty of MERCHANTABILITY or FITNESS FOR A PARTICULAR PURPOSE. See the GNU General Public License for more details.
You should have received a copy of the GNU Lesser General Public License along with this program. If not, see http://www.gnu.org/licenses/.
Definition at line 25 of file plotSolution.py.
| plotSolution.labelpad |
Definition at line 141 of file plotSolution.py.
| str plotSolution.line_color = "C4" |
Definition at line 117 of file plotSolution.py.
| plotSolution.lw |
Definition at line 139 of file plotSolution.py.
| plotSolution.mass = partData.mass |
Definition at line 70 of file plotSolution.py.
| plotSolution.ms |
Definition at line 85 of file plotSolution.py.
| int plotSolution.N = 1000 |
Definition at line 87 of file plotSolution.py.
| plotSolution.P = partData.pressure |
Definition at line 60 of file plotSolution.py.
| float plotSolution.P0 = 1.0e-6 |
Definition at line 27 of file plotSolution.py.
| plotSolution.P2_bin |
Definition at line 77 of file plotSolution.py.
| float plotSolution.P_0 = 1.0e-6 |
Definition at line 213 of file plotSolution.py.
| plotSolution.P_bin |
Definition at line 72 of file plotSolution.py.
| float plotSolution.P_L = 1.0 |
Definition at line 27 of file plotSolution.py.
| float plotSolution.P_R = 0.1 |
Definition at line 28 of file plotSolution.py.
Definition at line 91 of file plotSolution.py.
Definition at line 82 of file plotSolution.py.
| plotSolution.partData = reader.load() |
Definition at line 48 of file plotSolution.py.
| bool plotSolution.plot_errorbars = False |
Definition at line 39 of file plotSolution.py.
| plotSolution.pressure = partData.pressure |
Definition at line 68 of file plotSolution.py.
| str plotSolution.pvdfile = "particles.pvd" |
Definition at line 46 of file plotSolution.py.
Definition at line 64 of file plotSolution.py.
| float plotSolution.r_bin = 0.5 * (r_bin_edge[1:] + r_bin_edge[:-1]) |
Definition at line 69 of file plotSolution.py.
| plotSolution.r_bin_edge = np.arange(0.0, 1.0, 0.02) |
Definition at line 68 of file plotSolution.py.
Definition at line 218 of file plotSolution.py.
| plotSolution.r_shock |
Definition at line 218 of file plotSolution.py.
| plotSolution.reader = ParticleVTUReader(pvdfile=pvdfile, snapshot_time=time) |
Definition at line 47 of file plotSolution.py.
| plotSolution.rho = partData.density |
Definition at line 61 of file plotSolution.py.
| float plotSolution.rho0 = 1.0 |
Definition at line 26 of file plotSolution.py.
| plotSolution.rho2_bin |
Definition at line 75 of file plotSolution.py.
| float plotSolution.rho_0 = 1.0 |
Definition at line 212 of file plotSolution.py.
| plotSolution.rho_bin |
Definition at line 70 of file plotSolution.py.
| float plotSolution.rho_L = 1.0 |
Definition at line 23 of file plotSolution.py.
| float plotSolution.rho_R = 0.125 |
Definition at line 24 of file plotSolution.py.
Definition at line 90 of file plotSolution.py.
Definition at line 80 of file plotSolution.py.
| plotSolution.right |
Definition at line 281 of file plotSolution.py.
| int plotSolution.rows = 2 |
Definition at line 133 of file plotSolution.py.
Definition at line 97 of file plotSolution.py.
Definition at line 112 of file plotSolution.py.
| plotSolution.scatter_props |
Definition at line 121 of file plotSolution.py.
| dict plotSolution.sim_props |
Definition at line 235 of file plotSolution.py.
| dict plotSolution.solution_props |
Definition at line 244 of file plotSolution.py.
| plotSolution.solver = sphtools.RiemannSolver(gas_gamma) |
Definition at line 61 of file plotSolution.py.
| plotSolution.statistic |
Definition at line 70 of file plotSolution.py.
| float plotSolution.time = 0.2 |
Definition at line 42 of file plotSolution.py.
| plotSolution.top |
Definition at line 281 of file plotSolution.py.
| plotSolution.True |
Definition at line 281 of file plotSolution.py.
| plotSolution.u = partData.u |
Definition at line 58 of file plotSolution.py.
Definition at line 95 of file plotSolution.py.
| plotSolution.u2_bin |
Definition at line 79 of file plotSolution.py.
| plotSolution.u_bin |
Definition at line 74 of file plotSolution.py.
Definition at line 111 of file plotSolution.py.
Definition at line 84 of file plotSolution.py.
Definition at line 96 of file plotSolution.py.
Definition at line 65 of file plotSolution.py.
| int plotSolution.v0 = 1 |
Definition at line 28 of file plotSolution.py.
| plotSolution.v2_bin |
Definition at line 76 of file plotSolution.py.
| plotSolution.v_bin |
Definition at line 71 of file plotSolution.py.
| float plotSolution.v_L = 0.0 |
Definition at line 25 of file plotSolution.py.
Definition at line 74 of file plotSolution.py.
| float plotSolution.v_R = 0.0 |
Definition at line 26 of file plotSolution.py.
Definition at line 92 of file plotSolution.py.
Definition at line 81 of file plotSolution.py.
| plotSolution.vel_x = partData.v[:, 0] |
Definition at line 67 of file plotSolution.py.
| plotSolution.vel_y = partData.v[:, 1] |
Definition at line 69 of file plotSolution.py.
| plotSolution.vel_z = partData.v[:, 2] |
Definition at line 71 of file plotSolution.py.
| plotSolution.vx = partData.v[:, 0] |
Definition at line 56 of file plotSolution.py.
| plotSolution.vy = partData.v[:, 1] |
Definition at line 57 of file plotSolution.py.
| plotSolution.vz = partData.v[:, 2] |
Definition at line 69 of file plotSolution.py.
| float plotSolution.x = partData.x[:, 0] |
Definition at line 54 of file plotSolution.py.
| float plotSolution.x_max = 2.0 |
Definition at line 56 of file plotSolution.py.
| float plotSolution.x_min = 0.0 |
Definition at line 55 of file plotSolution.py.
| float plotSolution.x_s = np.arange(0, 2.0, 2.0 / N) - 1.0 |
Definition at line 89 of file plotSolution.py.
Definition at line 75 of file plotSolution.py.
| float plotSolution.y = partData.x[:, 1] |
Definition at line 55 of file plotSolution.py.
| plotSolution.yerr |
Definition at line 140 of file plotSolution.py.
| float plotSolution.z = partData.x[:, 2] |
Definition at line 66 of file plotSolution.py.
 1.9.8