 |
Peano
|
|
Peano
|
There are multiple postprocessing scripts shipped with the toolbox.
All of them use instances of OutputFile to parse a text file as written by Peano and then dump this information into various outputs. All of them rely on the fact that you have the logging switched on for the toolbox, and there are lines in the file with the trace
i.e. trace information has to be there as well.
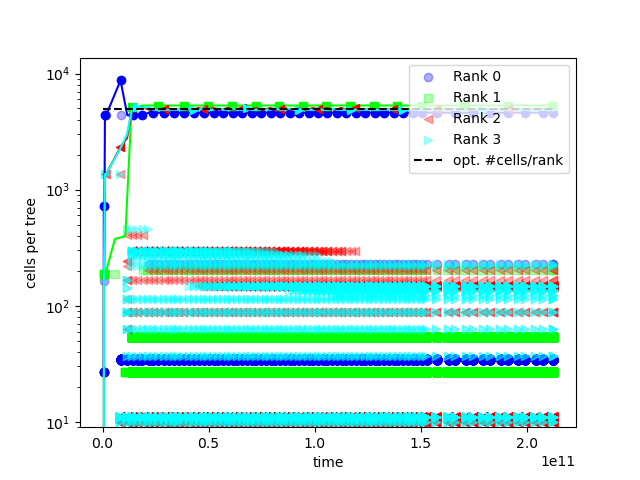
This type of visualisation is particularly helpful whenever we have dynamic load balancing and want to understand how the cells evolve over time. Apparently, the plot above does not employ dynamic rebalancing and hence is a pretty bad example for this script.

 1.9.8